Introduction to Reports
In addition to generating NC code, you can also generate various reports for a part, depending on the modules installed. When working with Bend technology, for example, it is useful to generate a setup sheet that lists the tools to be mounted and provides details on the bending sequence.
The Report Designer helps you design the content and style of reports. Once you design a report, you can output the report in PDF or HTML formats. Here is an example of how the report designer looks when it is open:
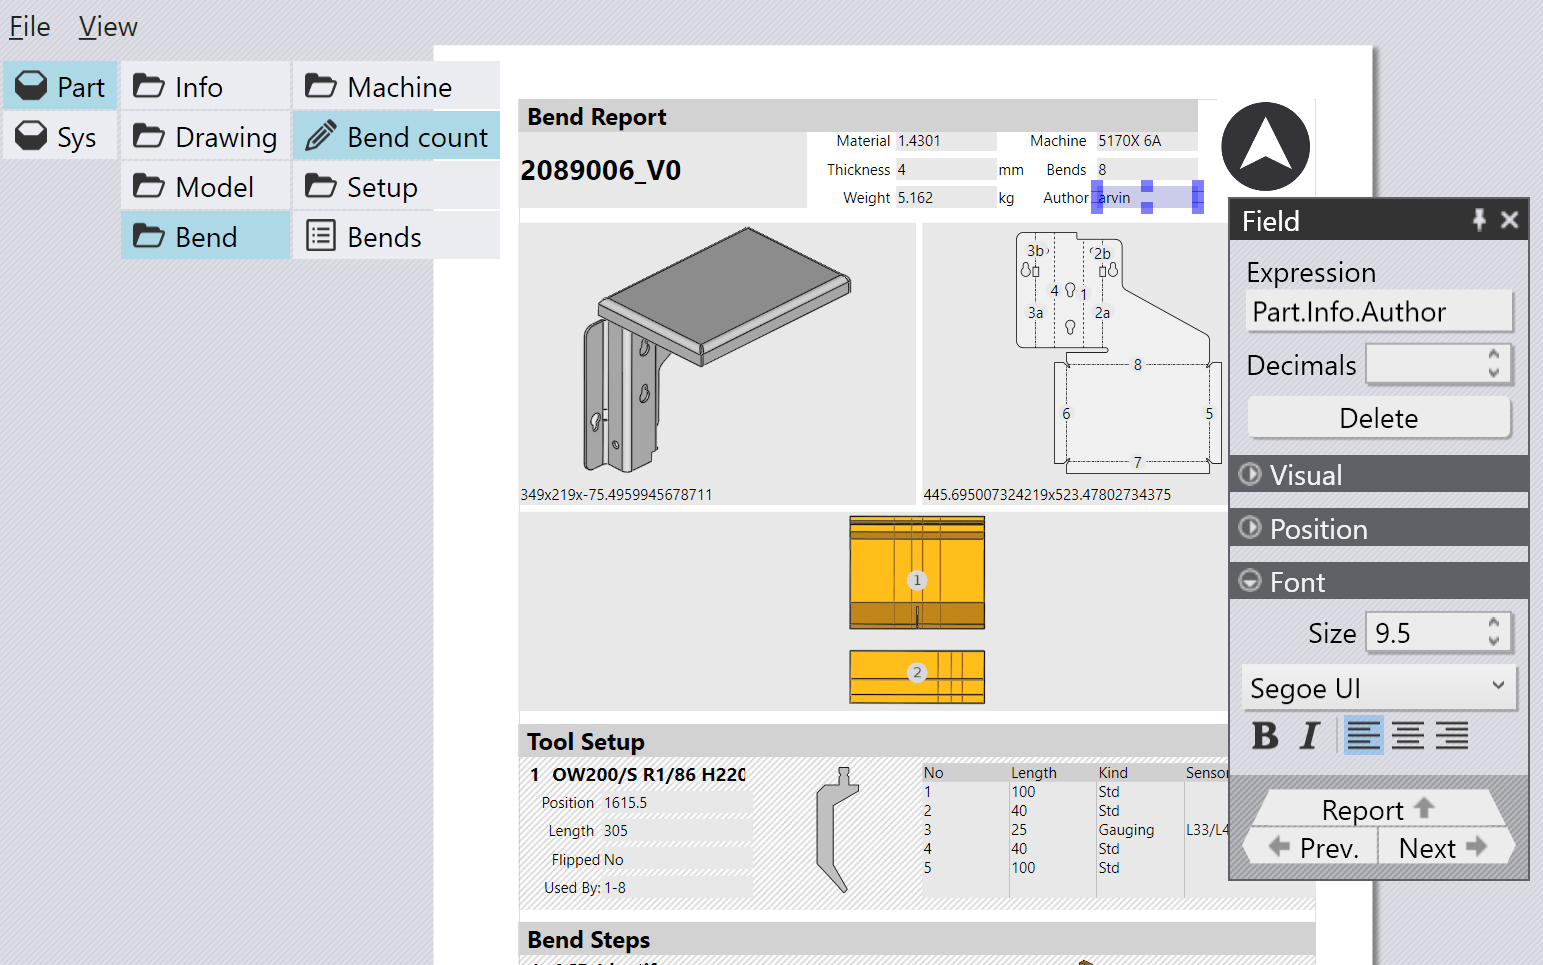
The Report Designer opens in its window, with two data sources to start with, called Part and Sys. The Part data source is used to pick various text, numeric and image fields from the part to insert into the report. The Sys data source is used to place other elements in the report like standard logos, geometric shapes, divider lines or other images.
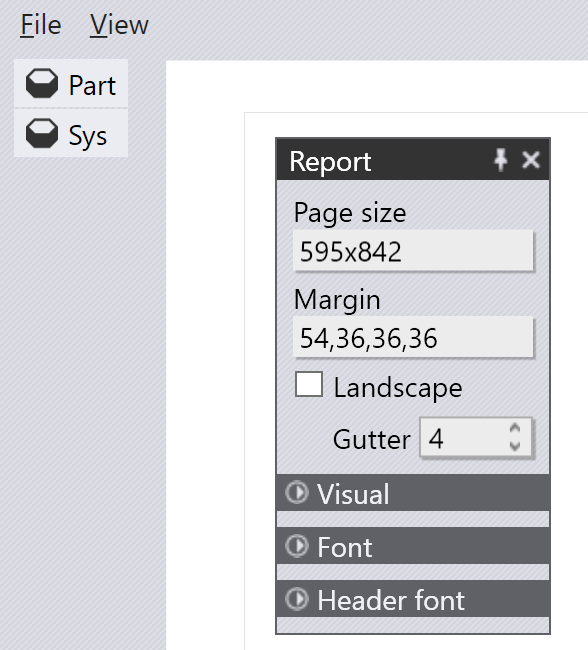
At this point, you can click on the empty page in the report to adjust the paper size, the orientation and the margins for the report. All sizes used in the report editor are in points. A point is 1/72 of an inch, and is the standard measure used in type-setting. The Gutter you see in the image above is the standard gap that Flux places between fields in a report. To edit these settings (such as paper size, and margins) later, just click on any element on the page, and then click on the ^Report link to navigate up to the settings for the report.
You can use the data sources to:
- Add Fields, Pictures and Tables to a report
- Create Bands or sub-reports
- Add static Labels, Bitmaps and Shapes